Robin McAlpine 15/01/2026 Robin McAlpine 15/01/2026 Line graph showing the relationship between your electricity and gas costs and the profits of the oil companies. Read More Robin McAlpine 08/01/2026 Robin McAlpine 08/01/2026 Line graph showing generational social attitudes on a liberal-authoritarian spectrum Read More Newer Posts
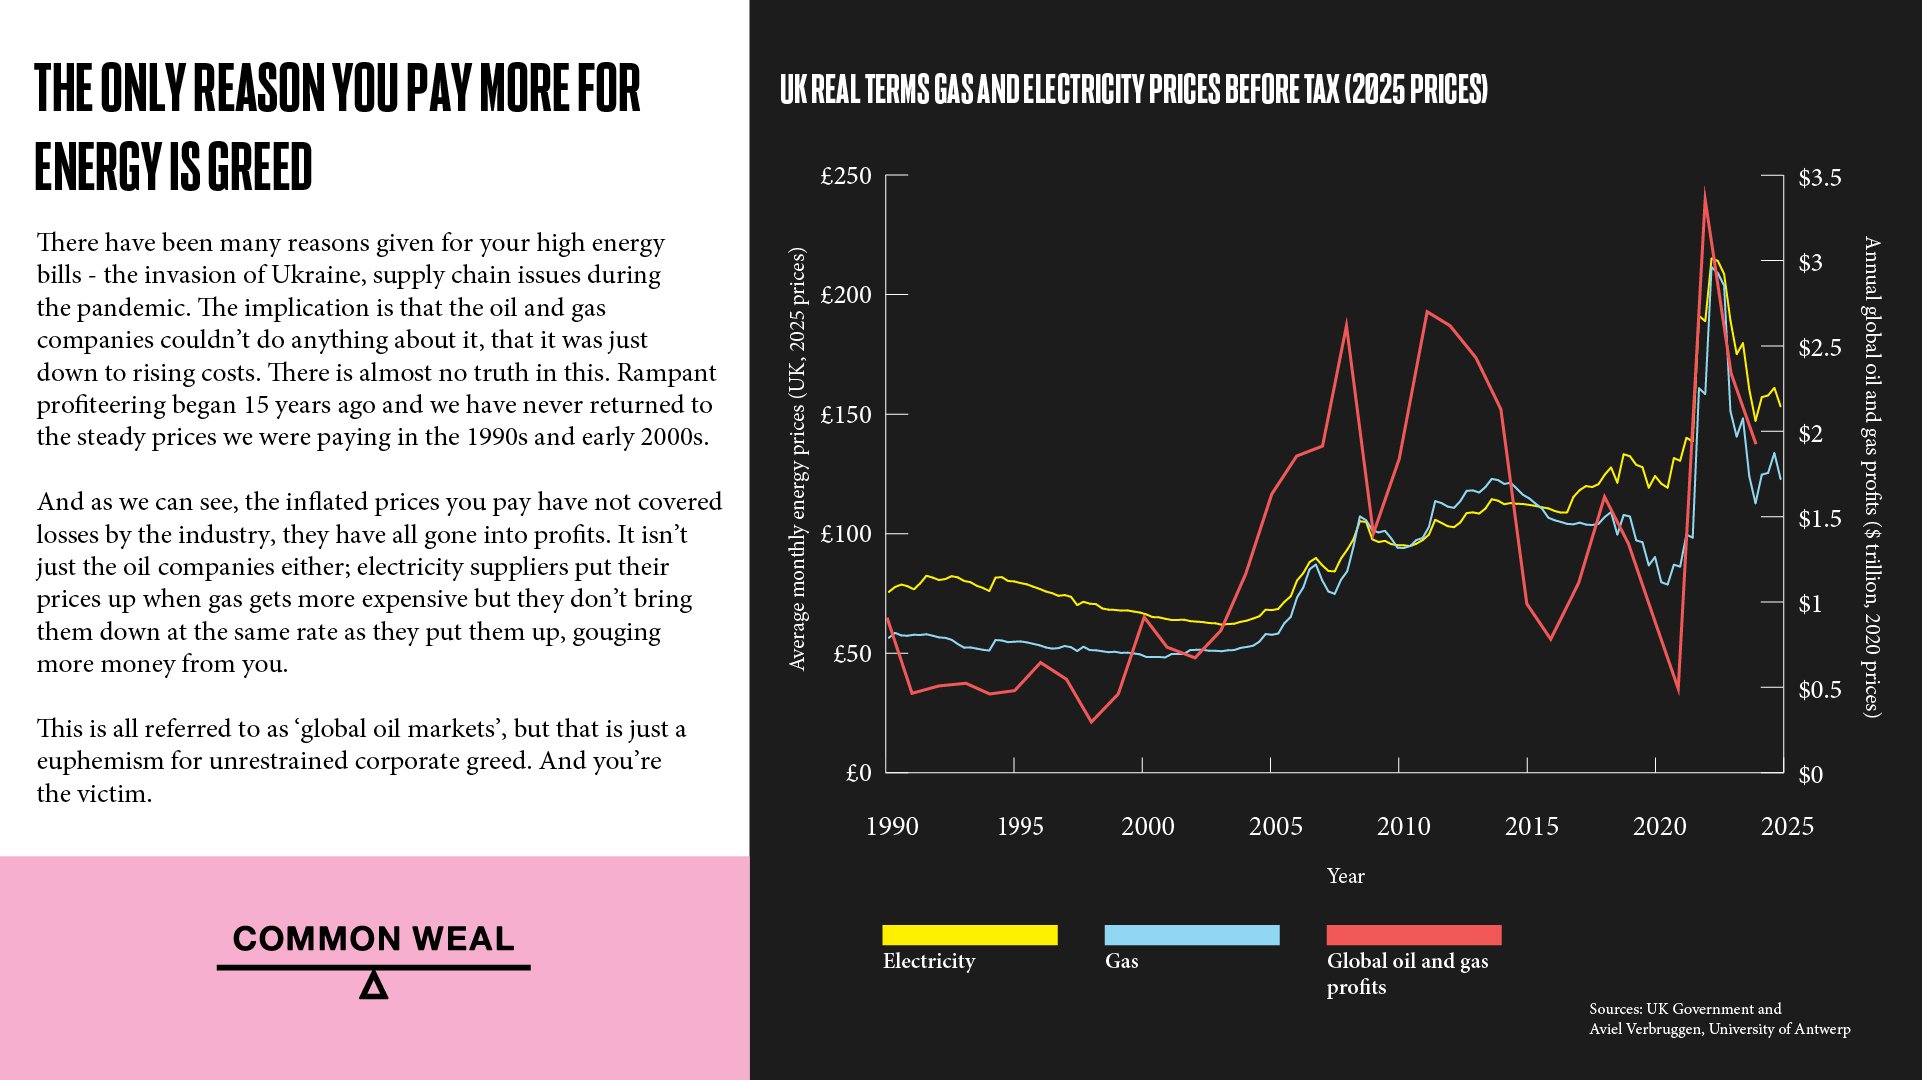
Robin McAlpine 15/01/2026 Robin McAlpine 15/01/2026 Line graph showing the relationship between your electricity and gas costs and the profits of the oil companies. Read More
Robin McAlpine 08/01/2026 Robin McAlpine 08/01/2026 Line graph showing generational social attitudes on a liberal-authoritarian spectrum Read More